Understanding The Yield Curve
Investors who have a strong understanding of how the economy works also tend to have a strong understanding of how investment cycles work. The information that is gathered is used to guide investment strategies. These strategies must be modified over the long haul, so that investors are maintaining profits and minimizing their risk factors.
All economic conditions have to be considered in these instances. There are more than just recessions to care about. However, there is always going to be a great deal of discussion about recessions. Everyone wants to know when the next one will arrive and how they can prepare themselves.
Related: 7 Tips To Assist Long Distance Landlords
This is a natural instinct, of course. There is one key element of economic forecasting that has to be considered when real estate investors are looking to remain ahead of the curve. Let’s start by taking a closer look at the varying methods of economic forecasting….
Contents
Economic Forecasting Methods
There are three different methods that the real estate investor must consider. By learning more about the three methods, an investor can better understand their position in the current climate and how they can best position themselves going forward.
The three methods are as follows: economic data, observation and timing. As an investor increases their level of understanding of these three methods, they are able to envision economic shifts before they have a chance to take place. After all, it is always better to be proactive than reactive in these sorts of instances.
Economic data is typically the most interesting to those who like to crunch numbers on a consistent basis. There is one area that needs to be studied first, though. Those who understand the yield curve are able to truly take their real estate investments to the next level.
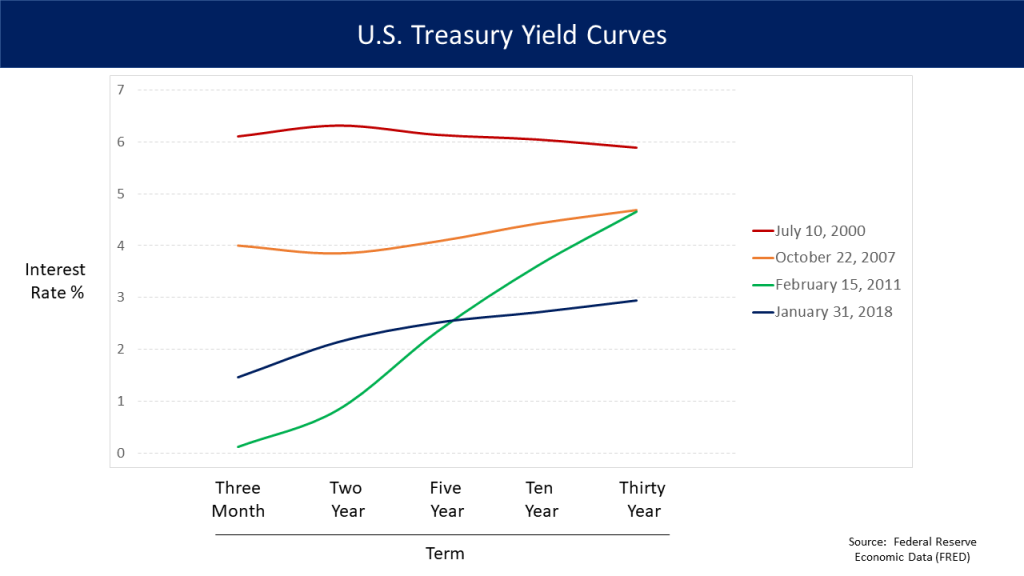
What Is The Yield Curve, Exactly?
Government bonds have different expiration dates and the yield curve serves as a representation of the changes that are made in various interest rates. In order to fully understand the yield curve, there are two key facts to consider. First of all, the United States government is in the habit of selling bonds in order to finance itself.
Related: Cost Segregation For Multifamily Investors: Why It Is Necessary
These treasury bonds are provided to investors, who are then able to receive a fixed amount of interest. Secondly, these bonds also come with expiration dates. This lets the investor know how long they will need to maintain the bond for before they can cash in for a full payout. If the bond is a long term bond, it can extend for up to 30 years.
A bond with a shorter expiration date is not going to offer the same level of return as a long term bond. Long term bond holders are believed to represent an opportunity cost. The investor is not able to use the money that was spent on the bond but they are able to reap a far greater return on the investment than they would have otherwise.
Note: Check our guide to learn how to calculate cash-on-cash return in excel.
How Does This Curve Look During a Healthy Economy?
There is a major difference when it comes to the return on investment of short and long term bonds when the economy is healthy. Those who are willing to invest over longer periods of time receive a much larger return from the government. Since the yields that are associated with these bonds change on a constant basis, the yield curve changes as well.
In these instances, ‘yield’ is just another term that is used to describe interest. The government is not actually responsible for controlling the bonds, however. The yield curve is determined by simple supply and demand. If there are a sizable amount of demand for the bond in question, the yield on the investment drops. As the demand decreases, the yield continues to rise.
Related: How To Prepare Properly Before Buying Your First Property
In demand bonds lead to lower returns. Investors must also pay close attention to the yield curve from a recession standpoint. As soon as the curve becomes inverted, it is time to prepare for a recession. It will take anywhere from 6 to 18 months for the recession to show itself, however.
Those who take the time to learn more about the yield curve are able to predict the ebb and flow of the market more easily. This is an invaluable tool for real estate investors of all backgrounds. An investor should know where they are in relation to the curve at all times.
Christine Winters
Christine is an experienced Content Writer at Zilculator. She graduated at Kansas State University and writes articles mainly for real estate investors. Her experience derives from owning 5 rental properties in 2 different states. She is currently planning to start wholesaling real estate as well.